FastHedge Research. Grow Wealth. Effortlessly.
Millions of small investors are ill-equipped to make sound investment decisions. We can help. Our advanced suite of automatic algorithms take the emotion out of investing, and allow you to improve returns while reducing risk simultaneously. That's a win-win. We are open for business. See the Subscribe page.
For more research details, see Figs. 1-3.
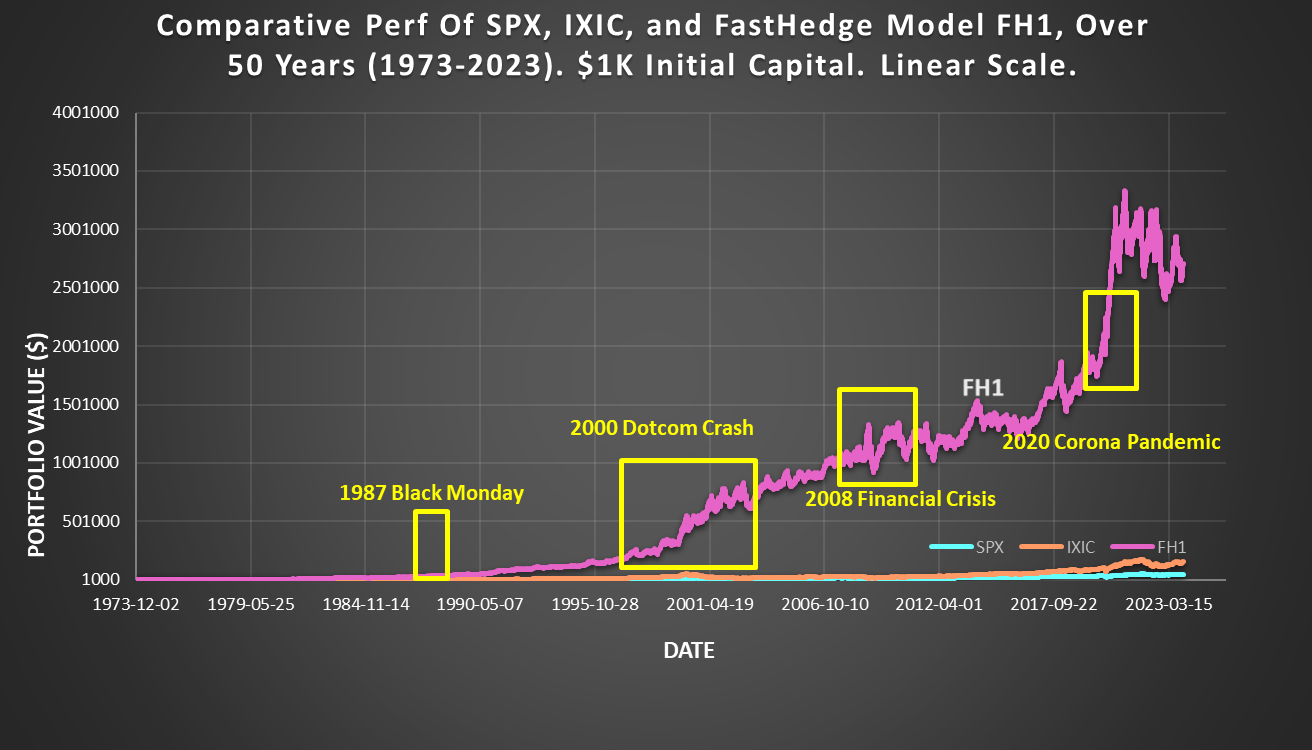
Fig. 1 shows growth of $1K initial investment over 50 years (1973-2023), plotting SPX, IXIC, and FastHedge Model 1 (FH1), in Linear Scale. Other models rise even faster, so we switch to Log Scale.
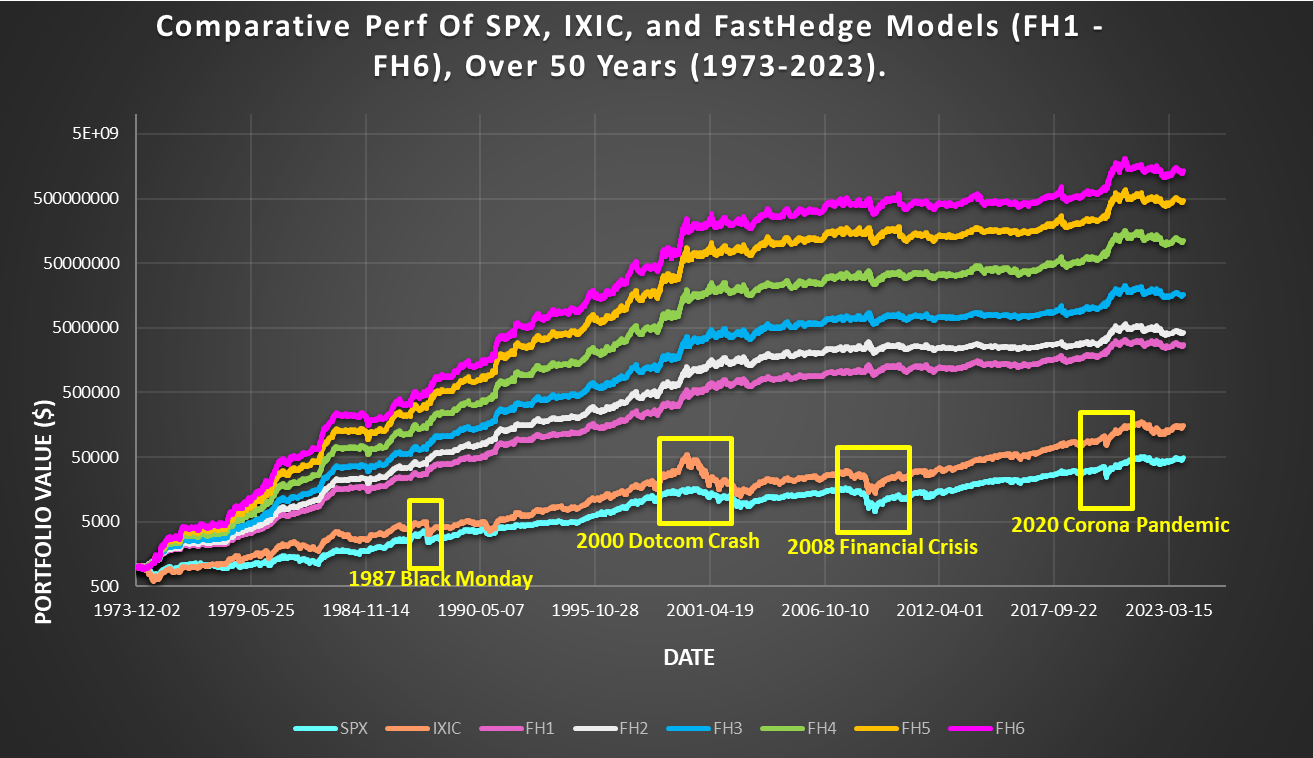
Fig. 2 shows growth of $1K initial investment over 50 years (1973-2023), plotting SPX, IXIC, and six FastHedge models with a wide spread of performance vs drawdowns (fig. 3). Note that higher returns do come with slightly higher drawdowns, but our system very effectively limits these without curbing higher gains.
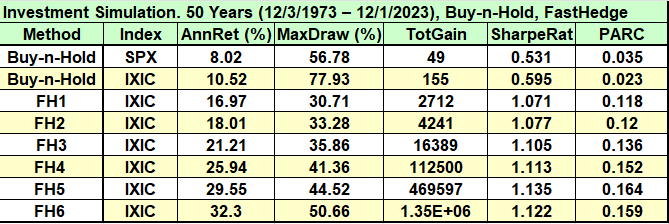
Fig. 3 shows the performance tabulated. We use standard metrics such as Annual Return (AnnR), Maximum Drawdown (MaxD), Total Gain, Sharpe Ratio, and an original measure called PARC. We define PARC = AnnR * (1 - MaxD). (More generally, PARC(a) = AnnR^a * (1-MaxD)^(1/a), a>0). By TotalGain, we mean a multiplier to the initial investment.
Our approach is based on a solid foundation described in our 2022-2024 peer-reviewed papers, paper1, paper2, paper3, paper4, that are quickly gaining interest. Investing in Nasdaq (IXIC) the past 50 years would have multiplied your money by 155X ($1K -> $155K). FastHedge blows that away, with 2712X ($1K -> $2.7M); see below.
Fig. 1. FastHedge Model 1 vs Buy-n-Hold of SP500 (SPX) and Nasdaq (IXIC), 1973-2023, in Linear Scale. $1K start.

Fig. 2. Six FastHedge Models vs Buy-n-Hold of SP500 (SPX) and Nasdaq (IXIC), 1973-2023, Log Scale. $1K start.

Fig. 3. Quantitative Analysis of results in Fig. 2. Performance measures include Annual Return, Maximum Drawdown, Total Gain, Sharpe Ratio, and an original measure called PARC.
